
Transforming IoT fleet monitoring with digital twin technology
Transforming IoT fleet monitoring with digital twin technology
Designed a MVP dashboard workflow to remotely monitor global assets and configure machines
Designed a MVP dashboard workflow to remotely monitor global assets and configure machines
Designed a MVP dashboard workflow to remotely monitor global assets and configure machines


Company
Infosys Wongdoody
Timeline
Feb 2022 (4 weeks)
Skills
Tools
Dashboard Design, Data Visualization Style guide, Prototyping
Adobe XD
Team
Skills
2 Designers, 2 Engineers, 1 Project Manager,
1 Subject Matter Expert
Dashboard Design, Data Visualization Style guide, Prototyping
Team
2 Designers, 2 Engineers, 1 Project Manager,
1 Subject Matter Expert
Role
Lead Experience Designer
Company
Infosys Wongdoody
Timeline
Feb 2022 (4 weeks)
Skills
Dashboard Design, Data Visualization Style guide, Prototyping
Team
2 Designers, 2 Engineers, 1 Project Manager,
1 Subject Matter Expert
Role
Lead Experience Designer
OVERVIEW
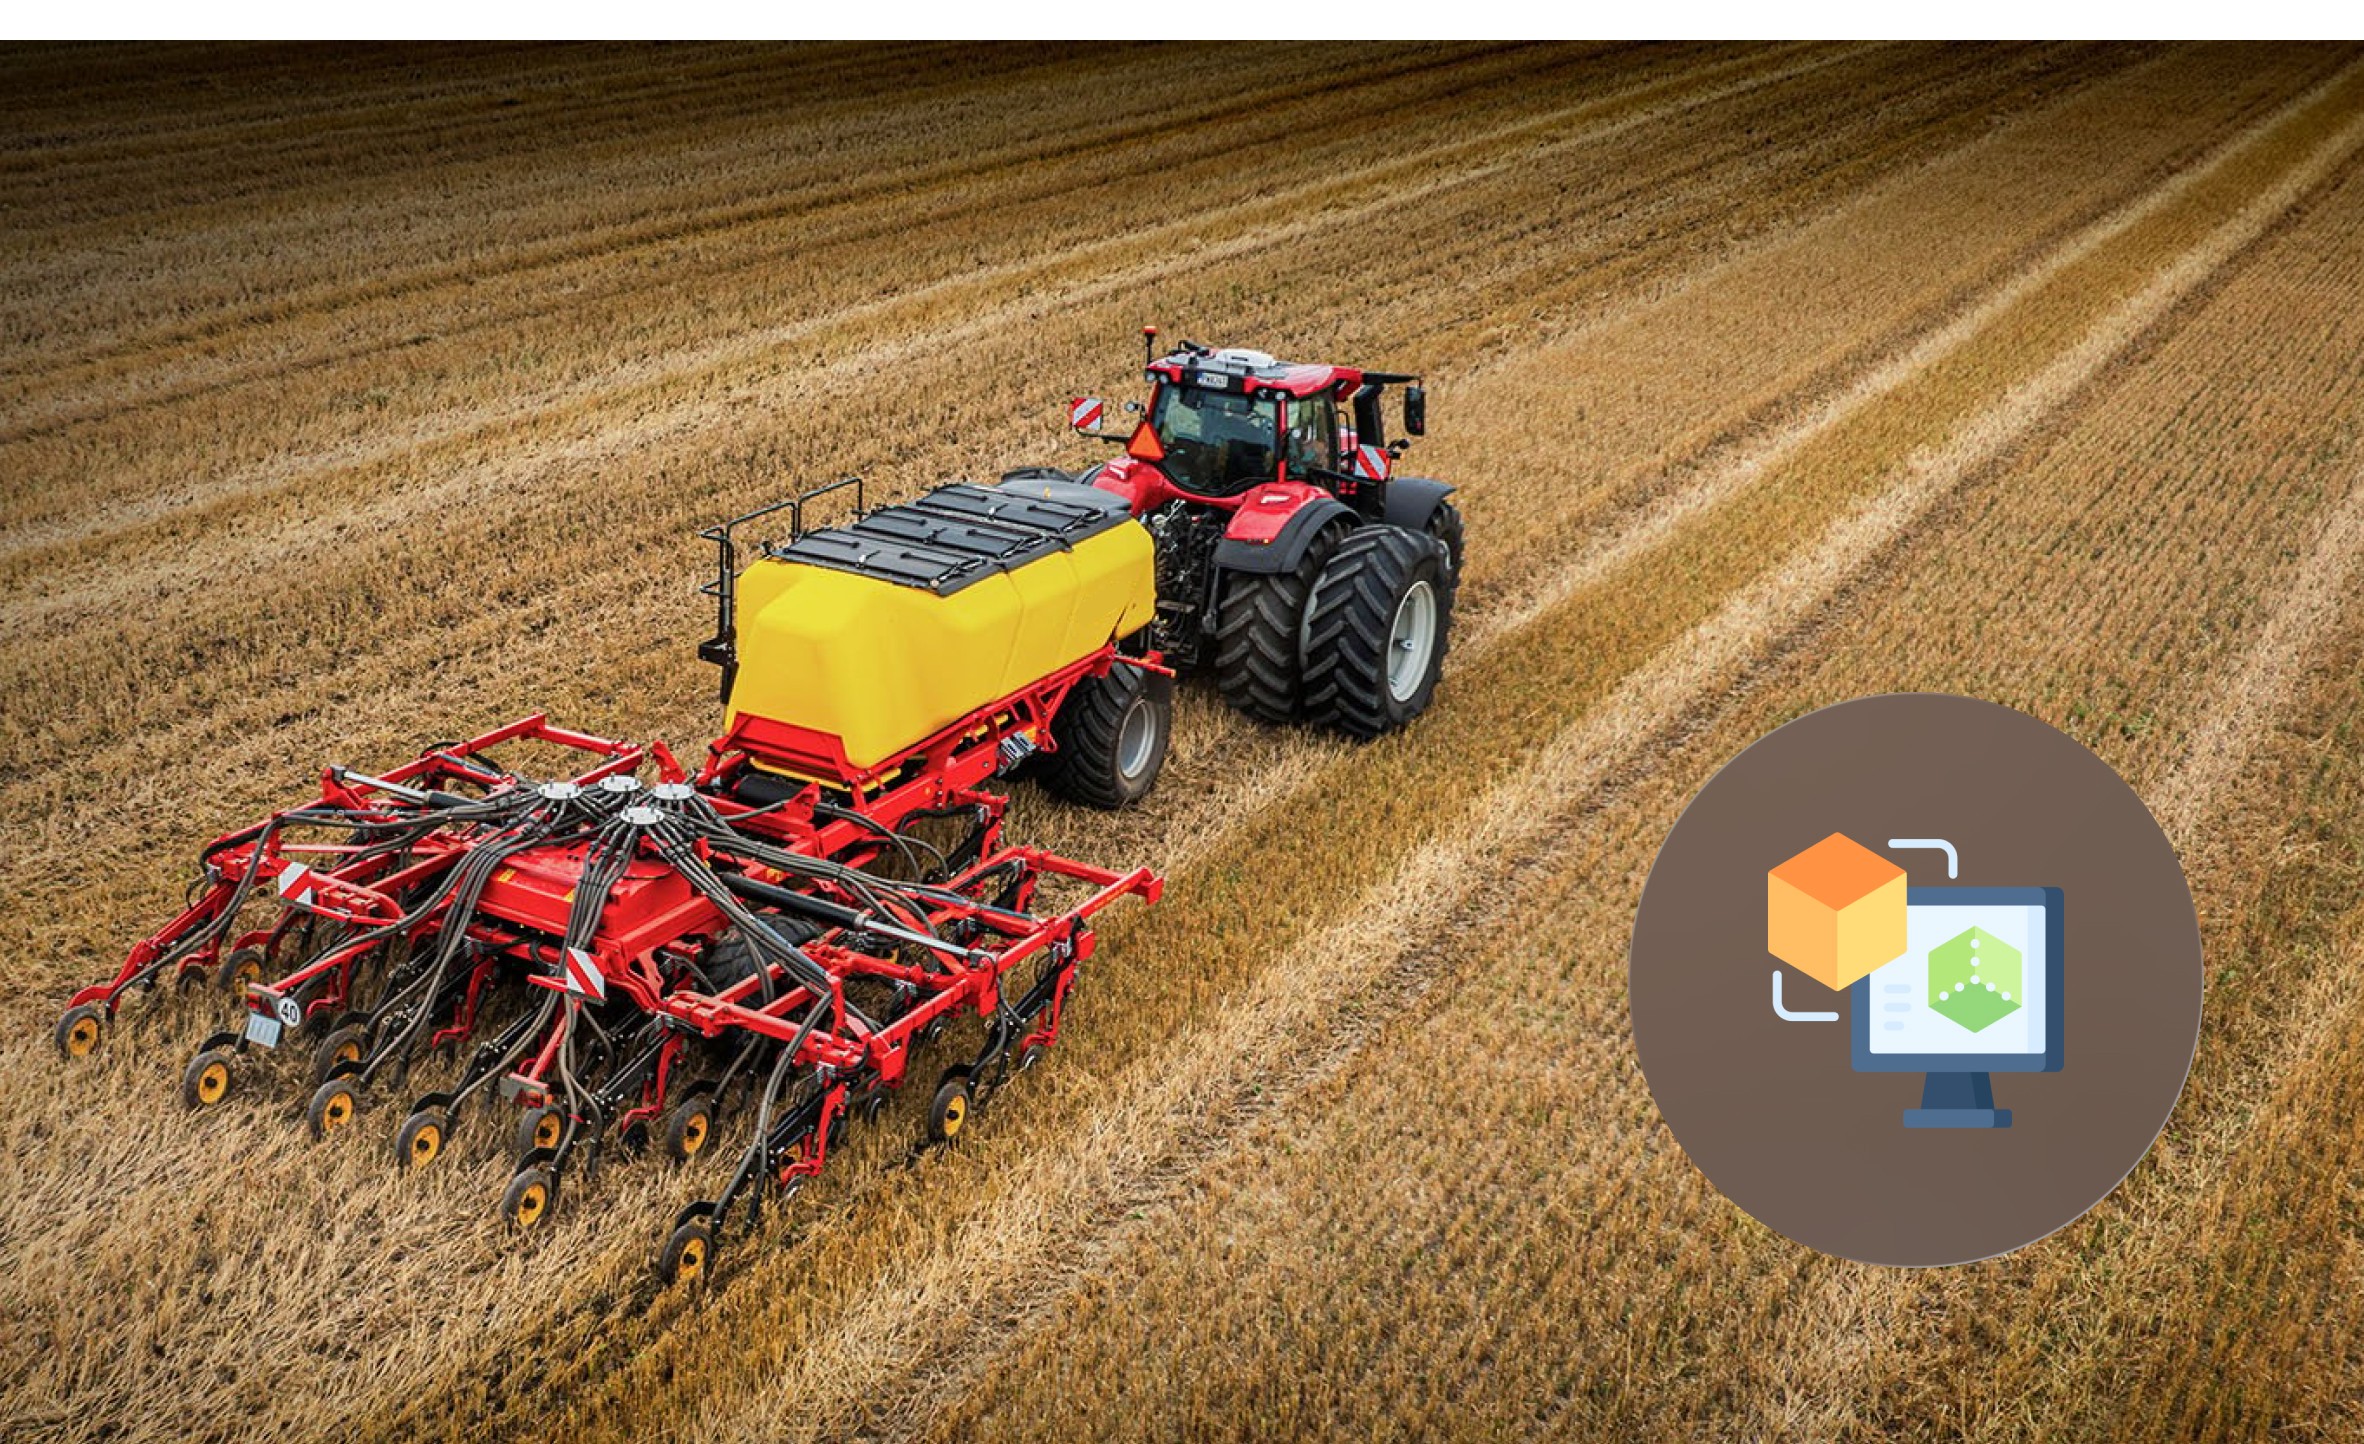
A Swedish farming machinery manufacturer, specializing in soil preparation and seeding equipment needed to digitize their FeedSeed machines by creating digital twin application and leveraging real-time data analytics to enhance operations across their global network.
As a part of this MVP project initiative, our team at Infosys wongdoody delivered a digital twin dashboard workflow that enables real-time global asset monitoring and prioritized error management.
My Contribution
As the UI/UX designer on this project, I collaborated with a team of domain experts (engineers, SMEs, developers) and a senior designer to establish the visual style guide and design the detailed high fidelity prototypes.
Project Outcome
Project Outcome

The MVP (Minimum Viable Product) successfully
secured client buy-in to expand this into a full-scale project.
The MVP (Minimum Viable Product) successfully
secured client buy-in to expand this into a full-scale project.
The MVP (Minimum Viable Product) successfully
secured client buy-in to expand this into a
full-scale project.
The Ask
The client manufactures a fleet of agricultural machines including FeedSeed equipment that collects valuable operational data. The client wanted to leverage this data ecosystem of Feedseed machines and create its digital twin to harness
real-time insights for operational improvements, faster error response, and enhanced customer experience.
CHALLENGE
The real challenge was structuring and prioritizing machine data in a way that allowed users to access what they needed quickly, while also surfacing system-level insights like patterns of recurring alarms across geographies.
Translating complex IoT data into actionable,
user-friendly visualization.
CHALLENGE
The real challenge was structuring and prioritizing machine data in a way that allowed users to access what they needed quickly, while also surfacing system-level insights like patterns of recurring alarms across geographies.
Translating complex IoT data into actionable, user-friendly visualization.
Design Process
4 weeks

Design Process
4 weeks
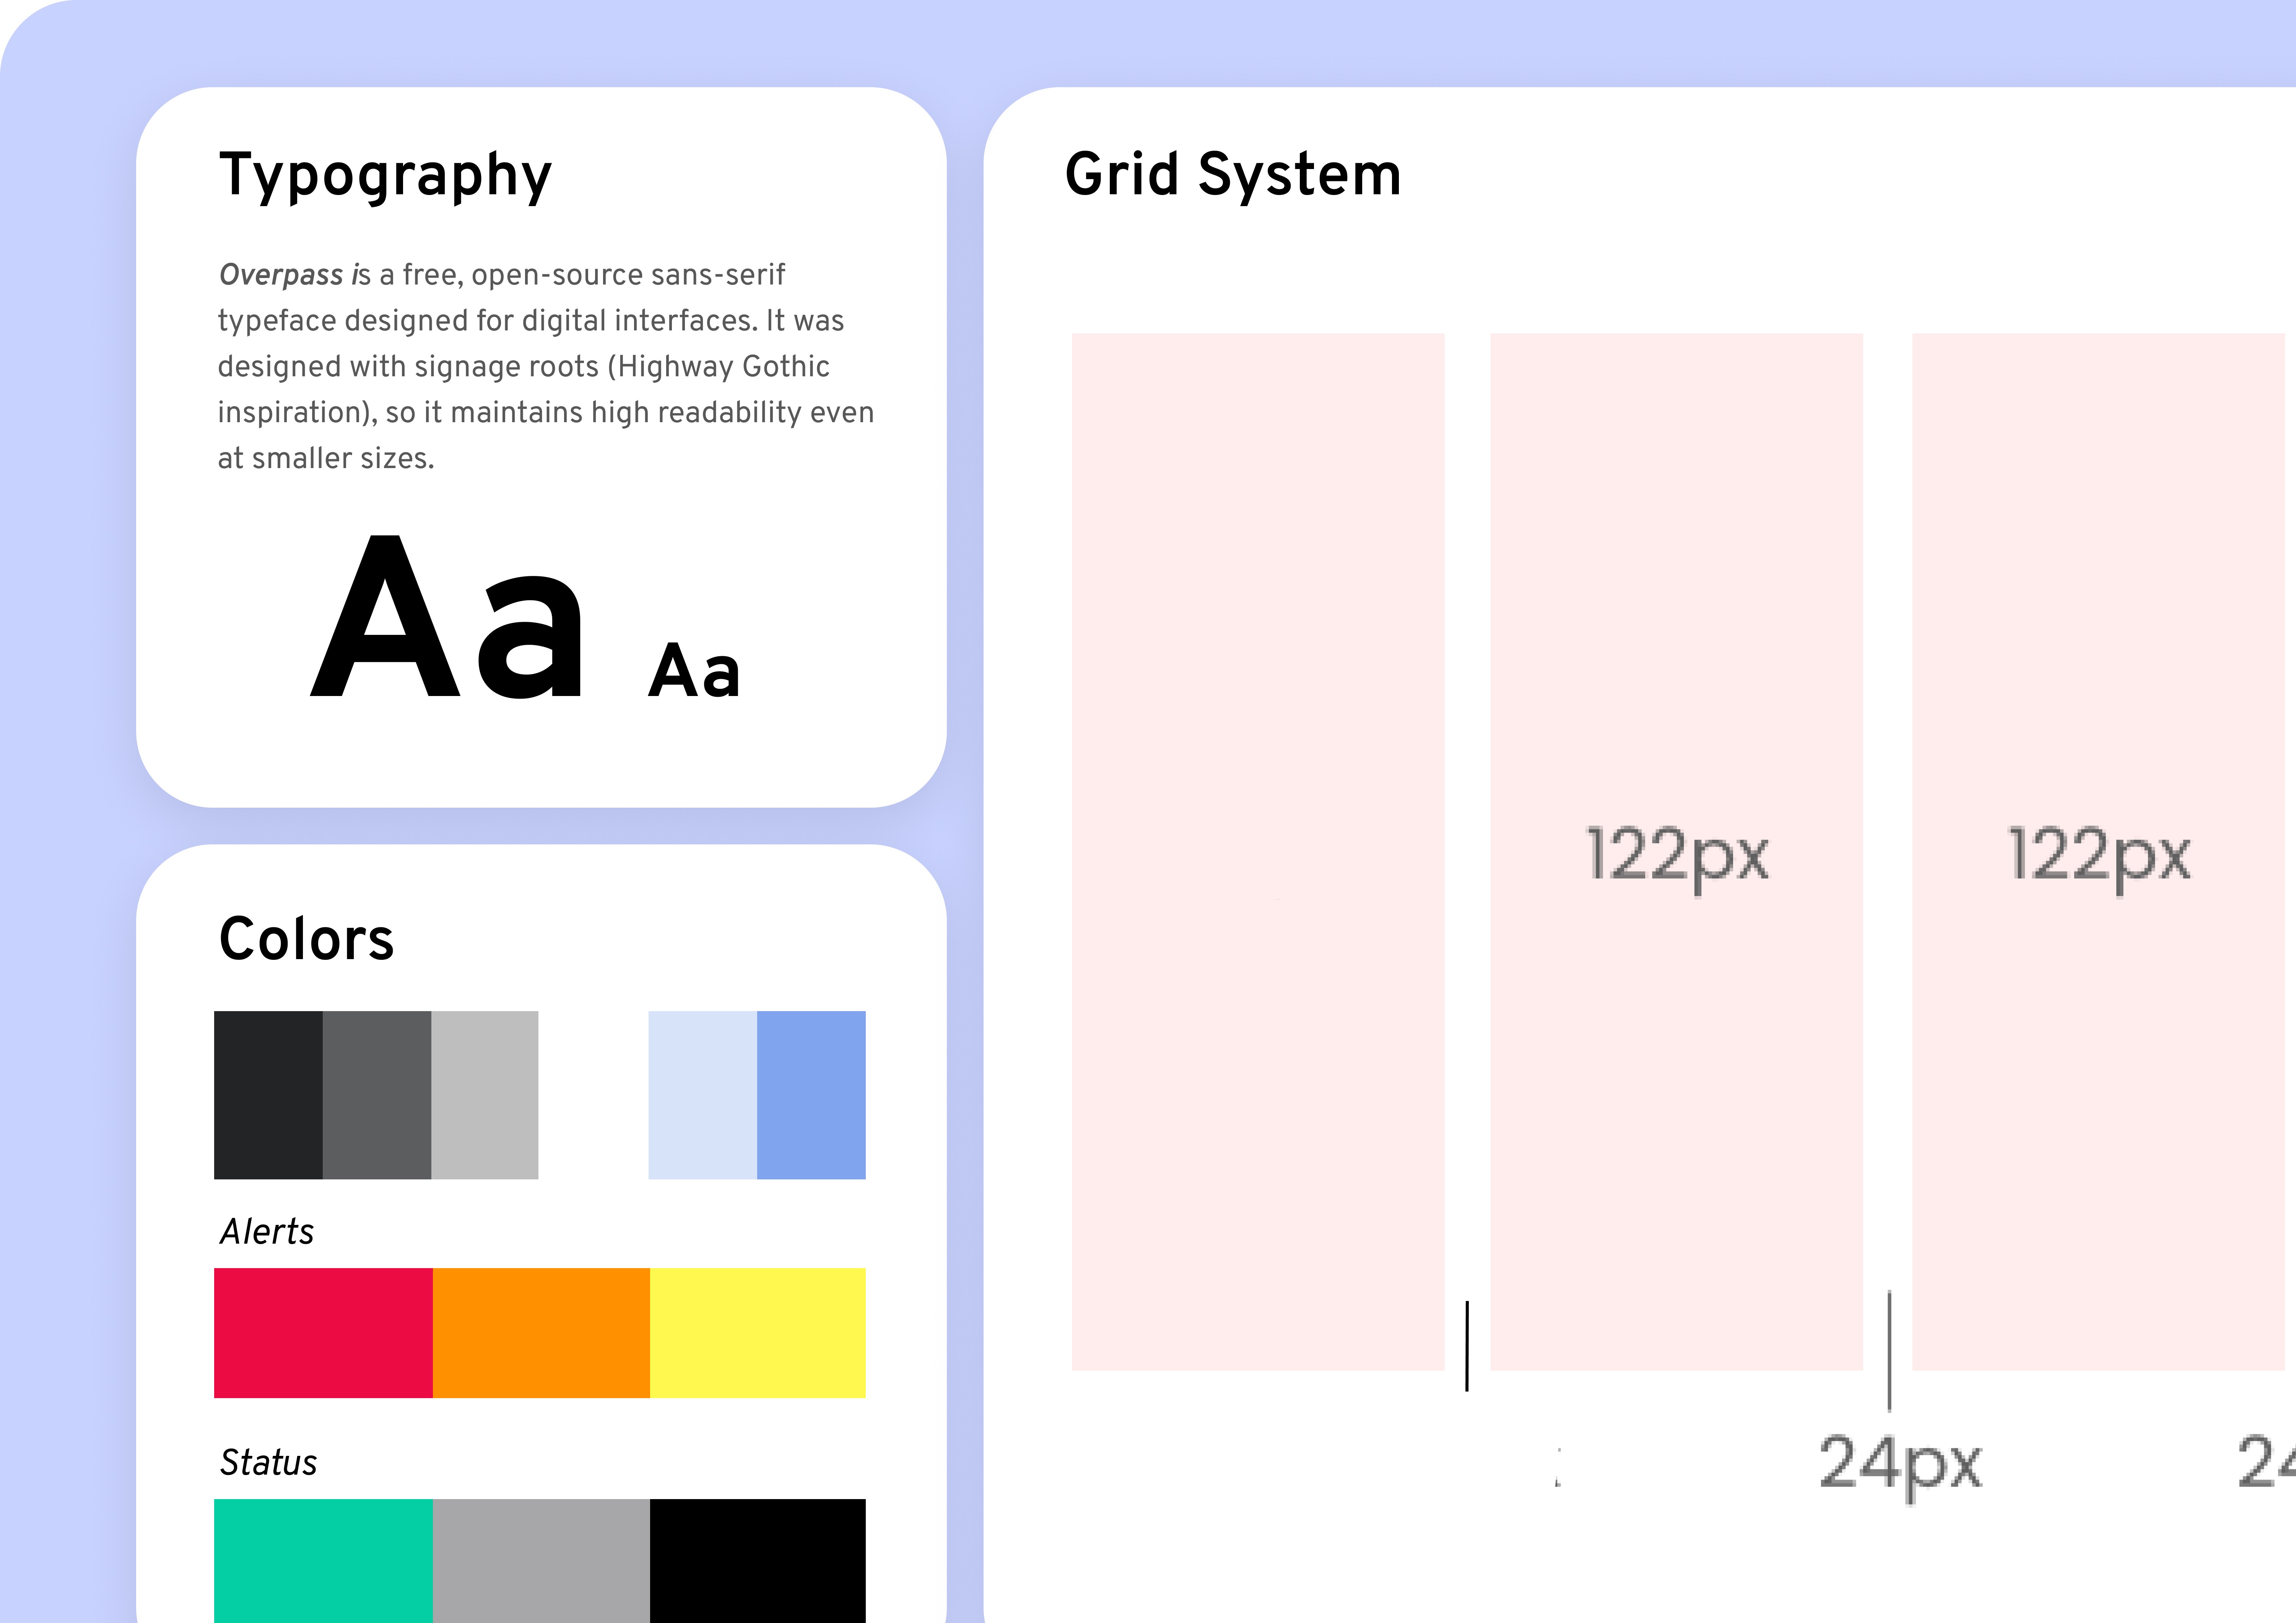
STYLEGUIDE & COMPONENTS
The visual language was aligned with existing internal tools familiar to users, reusing alarm & status colors from their current labeling system.
Insights from contextual mapping revealed systemic inefficiencies across three key areas
Insights from contextual mapping revealed systemic inefficiencies across three key areas
Digital Twin Opportunity
A. Converting FeedSeed machines into digital twins with real-time monitoring will enable faster action on errors, improved customer experience, and optimized machine allocation especially during the seeding season.
B. The platform can also configure new machines by adding sensors and modules, and see how they might perform before they are manufactured.
Reactive Maintenance
Reactive Maintenance
The team uses the data collected from feedseed machines, with issues discovered reactively
leading to delayed responses during critical seeding seasons.
The team uses the data collected from feedseed machines, with issues discovered reactively
leading to delayed responses during critical seeding seasons.
Service Territory Structure
Service Territory Structure
Client operates strategic service zones ("war zones") positioned near customer regions, housing personnel ready for rapid deployment to fix the issues but only after alerts are reported.
Client operates strategic service zones ("war zones") positioned near customer regions, housing personnel ready for rapid deployment to fix the issues but only after alerts are reported.
Operational Consequence
Operational Consequence
Equipment delays during seeding season directly impact farming schedules and crop success, making rapid response and preventive maintenance critical for customer satisfaction.
Equipment delays during seeding season directly impact farming schedules and crop success, making rapid response and preventive maintenance critical for customer satisfaction.
Digital Twin Opportunity
A. Converting FeedSeed machines into digital twins with real-time monitoring will enable faster action on errors, improved customer experience, and optimized machine allocation especially during the seeding season.
B. The platform can also configure new machines by adding sensors and modules, and see how they might perform before they are manufactured.
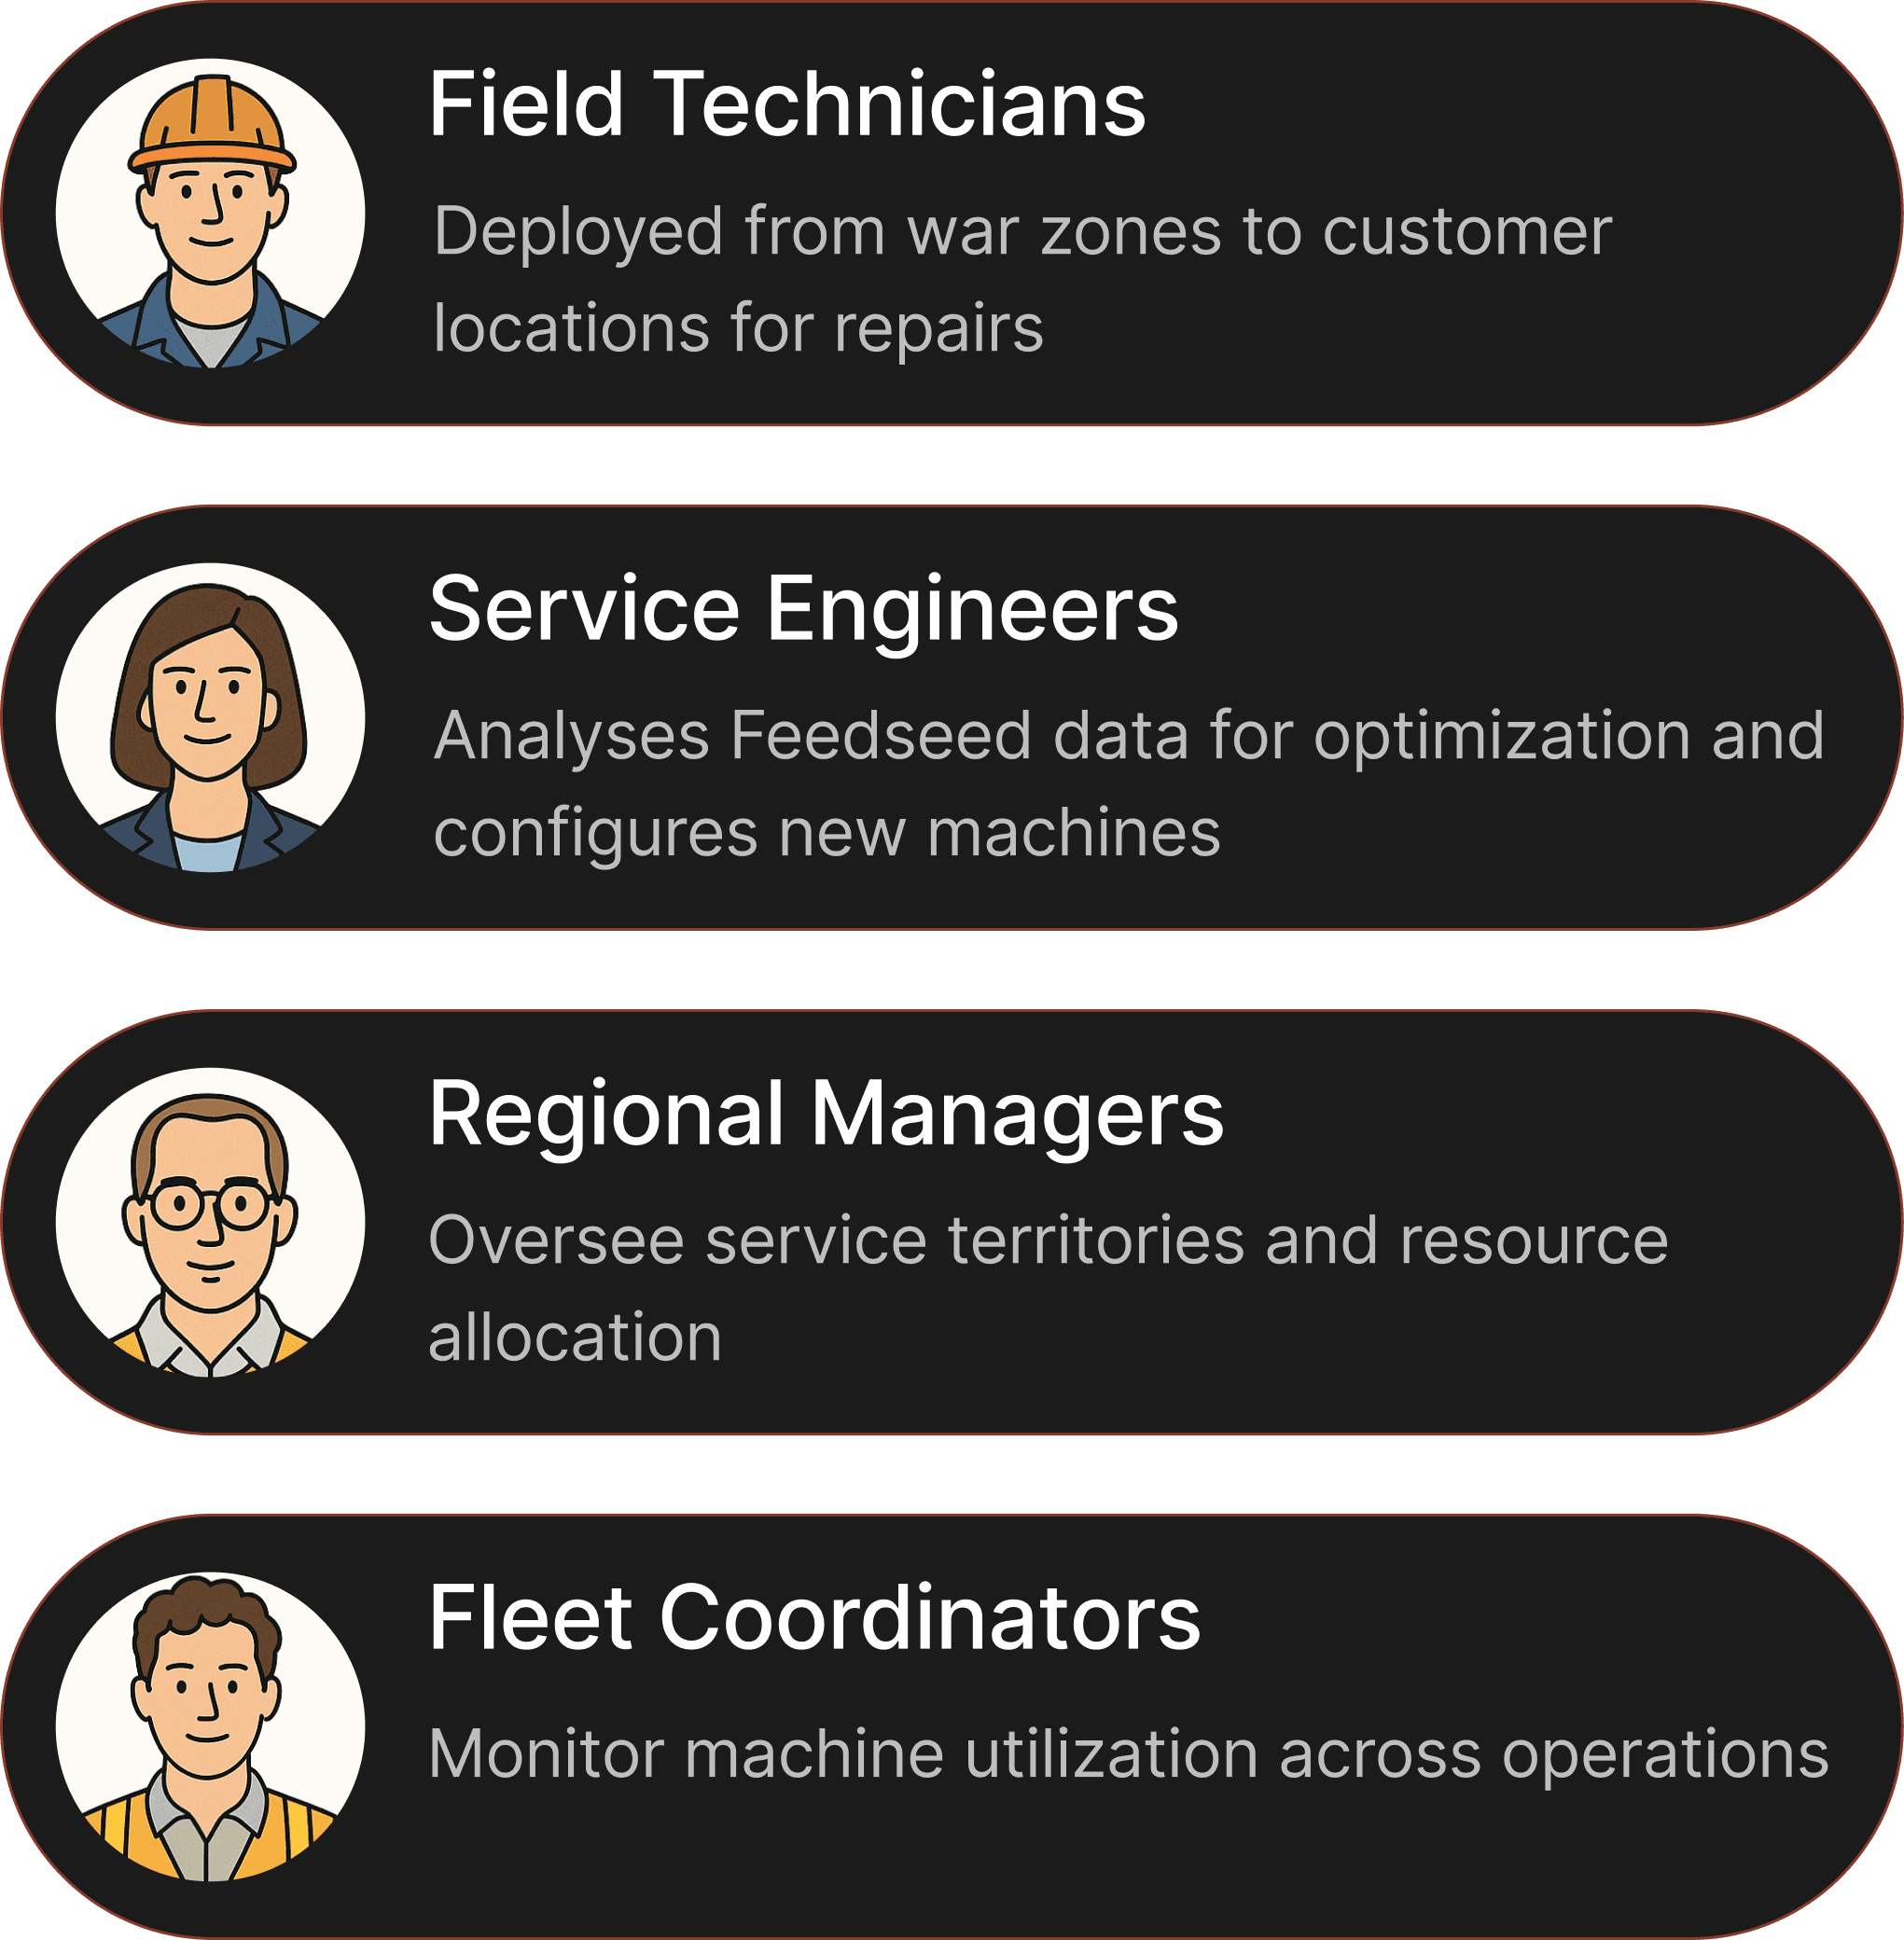
USER ROLES
Key Requirements
Need for a global fleet wide visbility
Requirement for remote diagnostics & predictive insights to prevent downtime
Prioritization of issues based on severity and data driven decision making
Ability to configure new machines to test before manufacturing
For the MVP, we prioritized the requirements of service technicians and engineers, as they are the most impacted and primary users of our application.
How might we transform complex IoT sensor data into an intuitive workflow that enables faster decision-making and proactive service operations?
How might we transform complex IoT sensor data into an intuitive workflow that enables faster
decision-making and proactive service operations?
Core interface challenges addressed
Core interface challenges addressed
Information Hierarchy
Information Hierarchy
Structuring and prioritizing machine data to surface the most critical information while maintaining access to detailed diagnostics.
Structuring and prioritizing machine data to surface the most critical information while maintaining access to detailed diagnostics.

We addressed this by prioritizing asset views according to user groups, ensuring reduced information overload.
We addressed this by prioritizing asset views according to user groups, ensuring reduced information overload.
Balancing New with the Familiar
Balancing New with the Familiar
Designing an interface that respects users’ existing habit of viewing feedseed data in Excel-like tables.
Designing an interface that respects users’ existing habit of viewing feedseed data in Excel-like tables.
We addressed this by offering two distinct views for the asset data.
We addressed this by offering two distinct views for the asset data.
STYLEGUIDE & COMPONENTS
The visual language was aligned with existing internal tools familiar to users, reusing alarm & status colors from their current labeling system.
THE SOLUTION
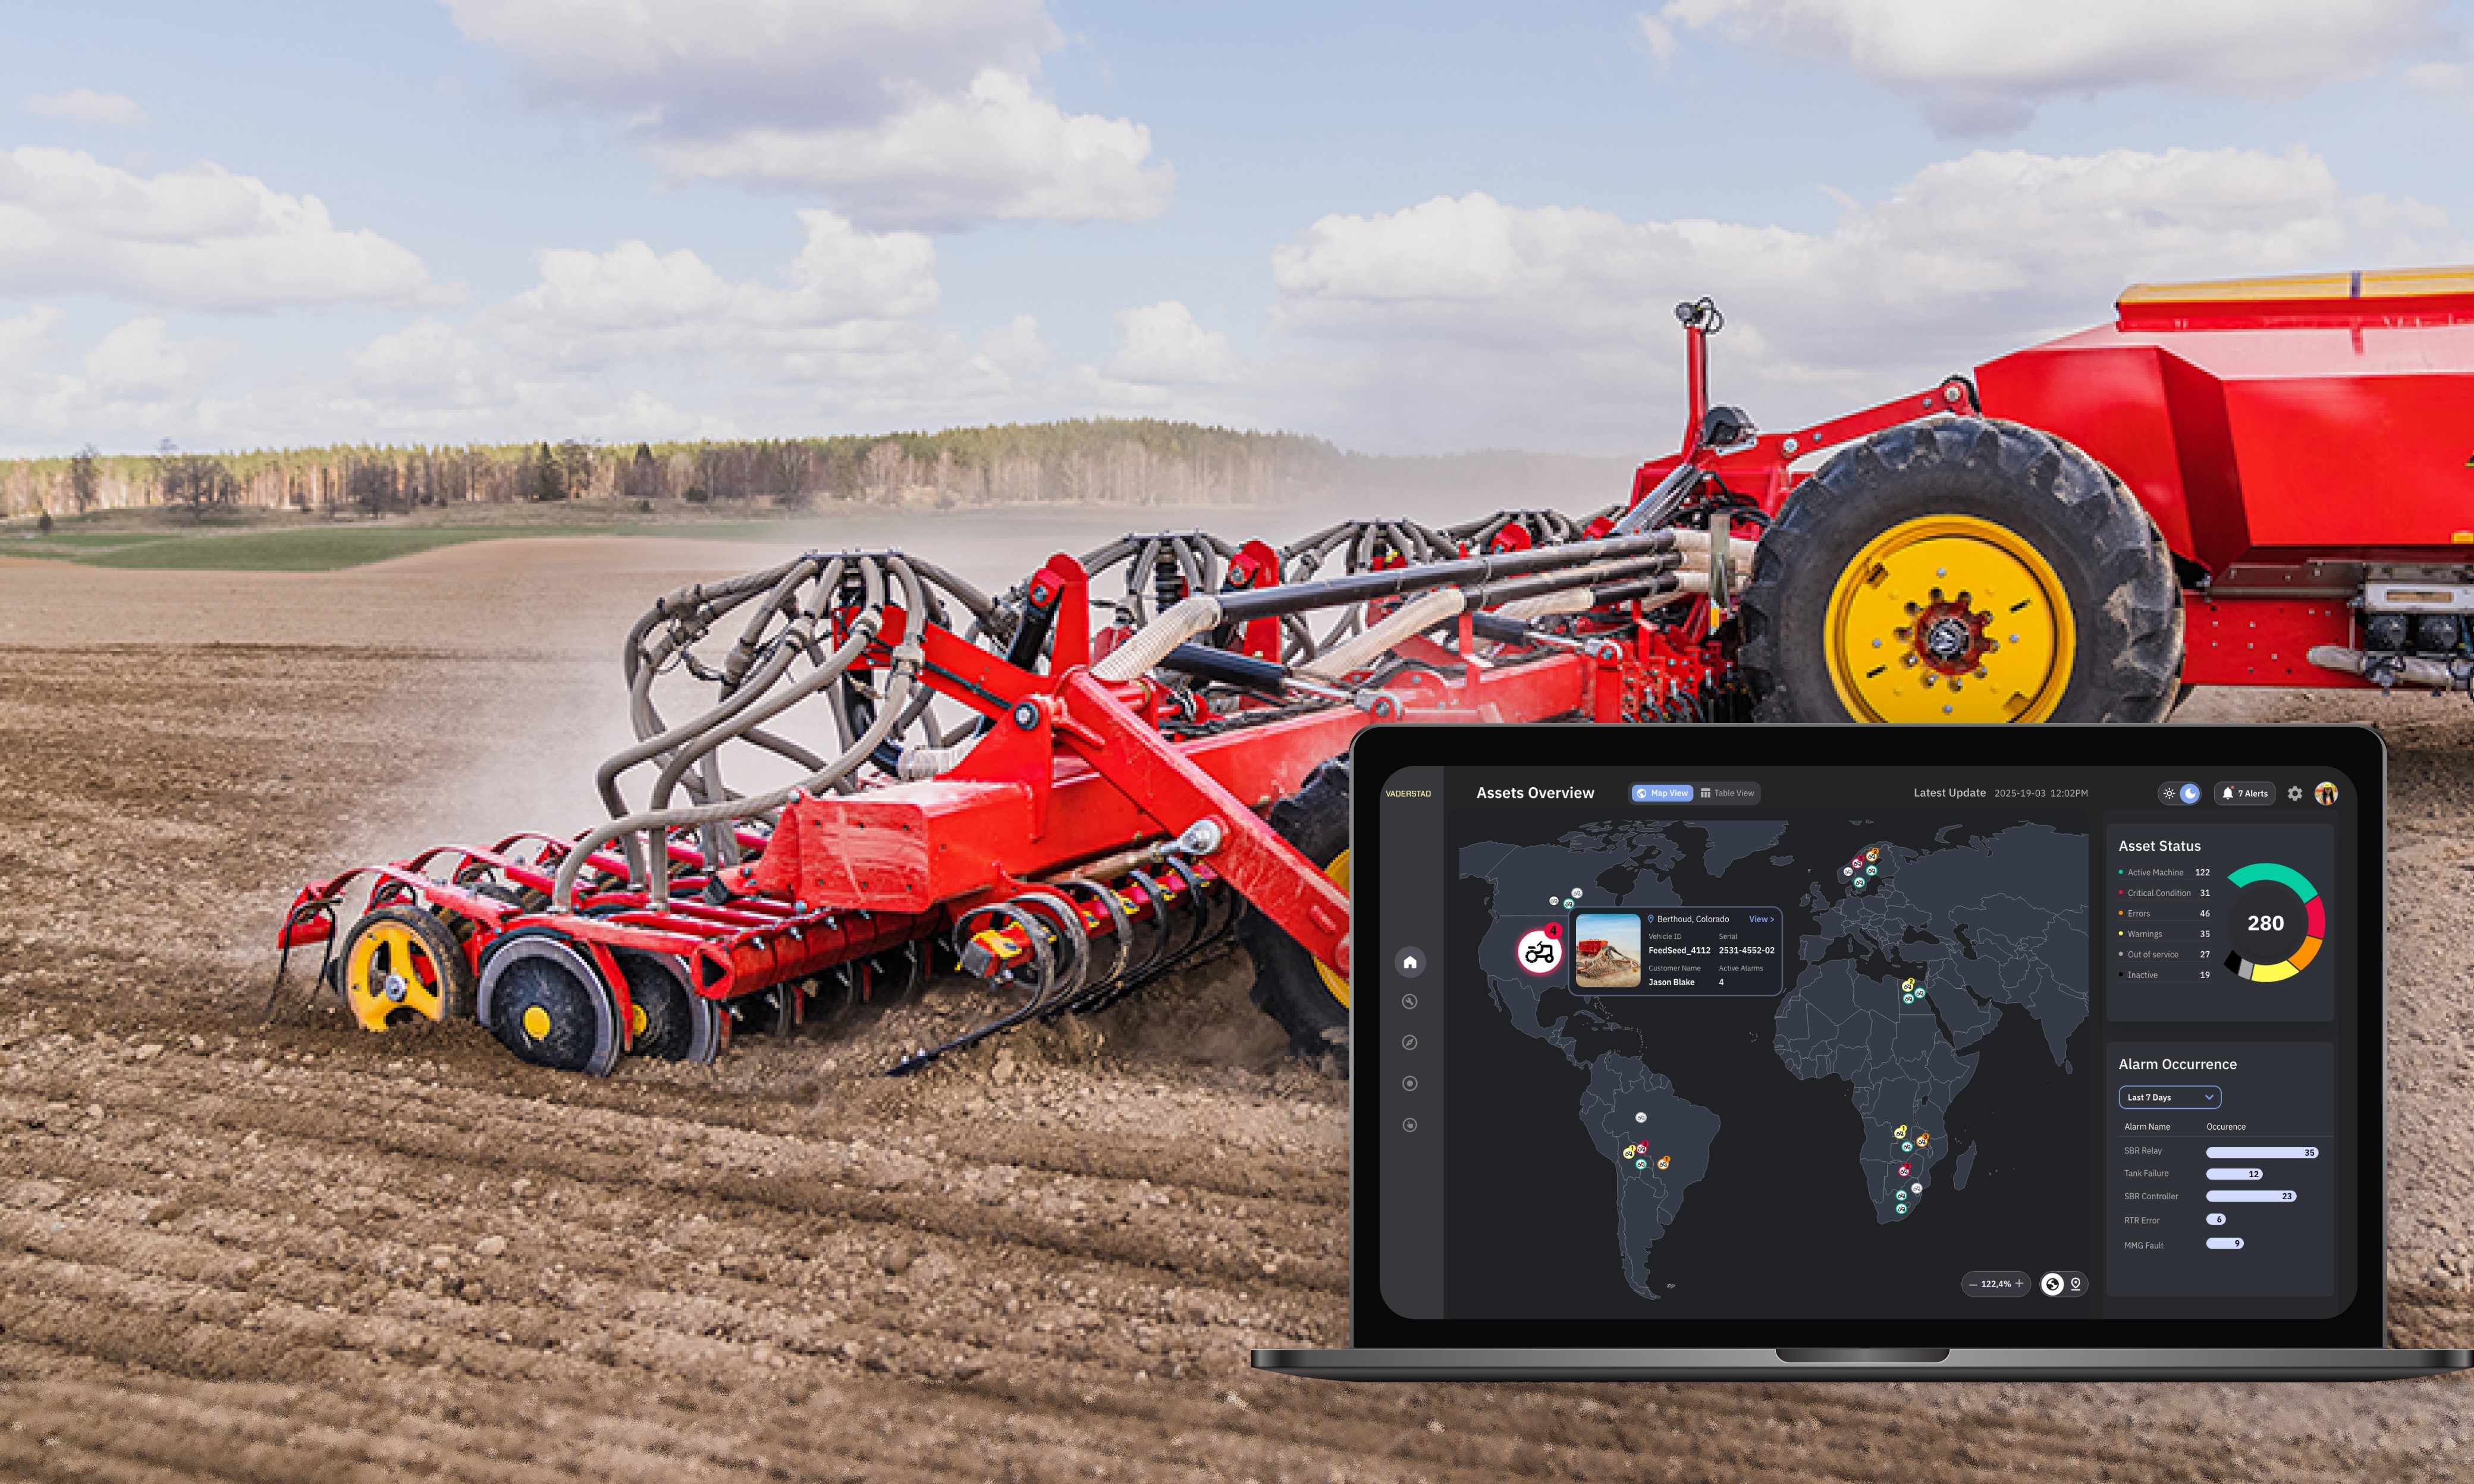
A digital twin application that transforms FeedSeed machines into connected digital asset, providing real-time monitoring, predictive maintenance, and fleet optimization capabilities.
The dashboard map view was designed to provide a real-time fleet overview, displaying all feedseed machines in operation with status indicators.
Machines operating normally were displayed in their default state, while those with active alarms were visually highlighted with alert icon

Highlevel overview of the asset details, ID, location and alarms aiding the the quick decision making for the service engineers
Highlevel overview of the asset details, ID, location and alarms aiding the the quick decision making for the service engineers
THE SOLUTION
The asset list offers a sortable overview of all machines. Machines with the highest severity were automatically prioritized at the top, helping teams quickly identify and respond to the most critical issues. This enabled technicians and engineers to triage effectively.
THE SOLUTION
Usecase 01: Global view
A digital twin application that transforms FeedSeed machines into connected digital asset, providing real-time monitoring, predictive maintenance, and fleet optimization capabilities.
The dashboard map view was designed to provide a real-time fleet overview, displaying all feedseed machines in operation with status indicators.
Machines operating normally were displayed in their default state, while those with active alarms were visually highlighted with alert icon
Highlevel overview of the asset details, ID, location and alarms aiding the the quick decision making for the service engineers
THE SOLUTION
Usecase 02: Asset list
The asset list offers a sortable overview of all machines. Machines with the highest severity were automatically prioritized at the top, helping teams quickly identify and respond to the most critical issues. This enabled technicians and engineers to triage effectively.
Design Impact
Design Impact
Users can quickly identify regional problem patterns, enabling proactive service deployment, faster issue resolution, reduced downtime, and optimized resources.
Users can quickly identify regional problem patterns, enabling proactive service deployment, faster issue resolution, reduced downtime, and optimized resources.
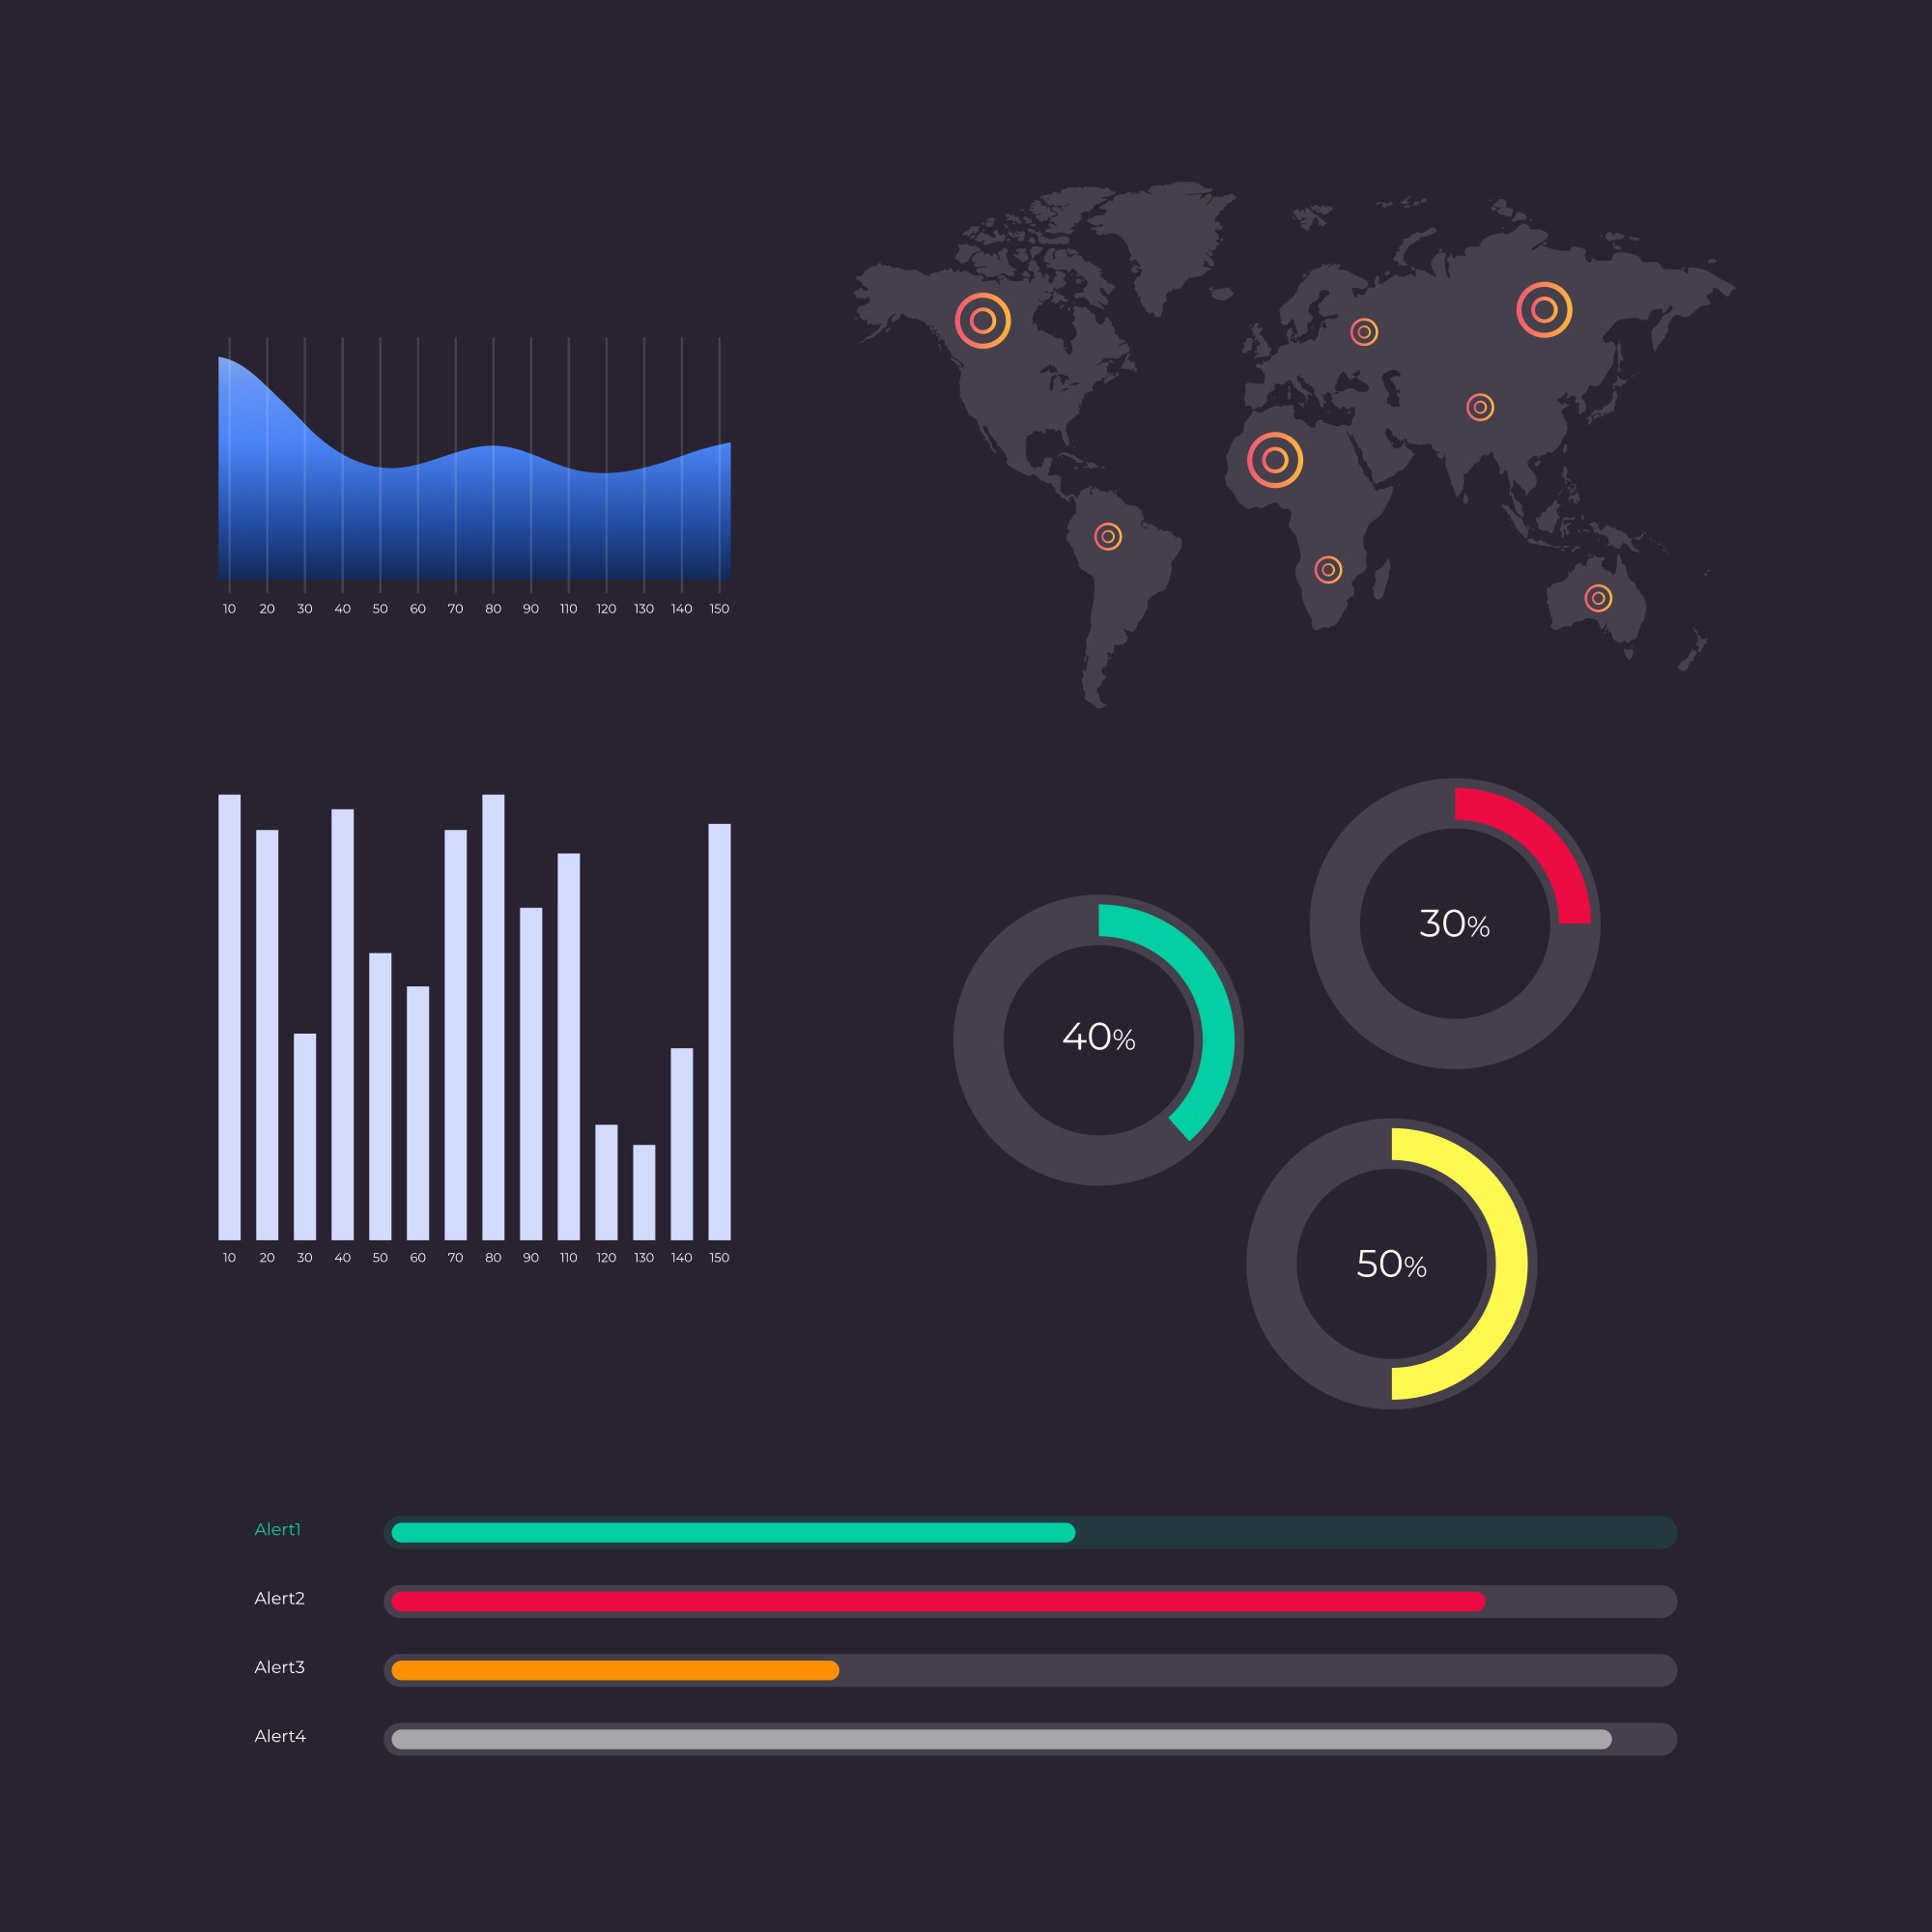
Projected Outcomes
Projected Outcomes
50%
50%
Reduction in response times
Reduction in response times
30%
Improvement in First-Time Fix Rate
30%
Improvement in First-Time Fix Rate
Learnings & Reflections
Learnings & Reflections
My north star : Does the interface help users make better decisions faster?
My north star : Does the interface help users make better decisions faster?
This project reinforced my belief that a good UX design required domain understanding and context awareness.
Working in the agricultural technology space required me to think beyond traditional digital interfaces and consider the real-world constraints and pressures that technicians and engineers face daily.
The challenge of transforming complex IoT data streams into actionable insights taught me the importance of information architecture in data-heavy applications.
Design Impact
Users can quickly identify regional problem patterns, enabling proactive service deployment, faster issue resolution, reduced downtime, and optimized resources.
STYLEGUIDE & COMPONENTS
The visual language was aligned with existing internal tools familiar to users, reusing alarm & status colors from their current labeling system.
USER ROLES
Key Requirements
Need for a global fleet wide visbility
Requirement for remote diagnostics & predictive insights to prevent downtime
Prioritization of issues based on severity and data driven decision making
Ability to configure new machines to test before manufacturing
For the MVP, we prioritized the requirements of service technicians and engineers, as they are the most impacted and primary users of our application.
Insights from contextual mapping revealed systemic inefficiencies across three key areas
Digital Twin Opportunity
A. Converting FeedSeed machines into digital twins with real-time monitoring will enable faster action on errors, improved customer experience, and optimized machine allocation especially during the seeding season.
B. The platform can also configure new machines by adding sensors and modules, and see how they might perform before they are manufactured.
Reactive Maintenance
The team uses the data collected from feedseed machines, with issues discovered reactively
leading to delayed responses during critical seeding seasons.
Service Territory Structure
Client operates strategic service zones ("war zones") positioned near customer regions, housing personnel ready for rapid deployment to fix the issues but only after alerts are reported.
Operational Consequence
Equipment delays during seeding season directly impact farming schedules and crop success, making rapid response and preventive maintenance critical for customer satisfaction.
Core interface challenges addressed
Information Hierarchy
Structuring and prioritizing machine data to surface the most critical information while maintaining access to detailed diagnostics.
We addressed this by prioritizing asset views according to user groups, ensuring reduced information overload.
Balancing New with the Familiar
Designing an interface that respects users’ existing habit of viewing feedseed data in Excel-like tables.
We addressed this by offering two distinct views for the asset data.
Design Process
4 weeks
Highlevel overview of the asset details, ID, location and alarms aiding the the quick decision making for the service engineers
Highlevel overview of the asset details, ID, location and alarms aiding the the quick decision making for the service engineers
THE SOLUTION
A digital twin application that transforms FeedSeed machines into connected digital asset, providing real-time monitoring, predictive maintenance, and fleet optimization capabilities.
The dashboard map view was designed to provide a real-time fleet overview, displaying all feedseed machines in operation with status indicators.
Machines operating normally were displayed in their default state, while those with active alarms were visually highlighted with alert icon
Usecase 01: Global view
THE SOLUTION
The asset list offers a sortable overview of all machines. Machines with the highest severity were automatically prioritized at the top, helping teams quickly identify and respond to the most critical issues. This enabled technicians and engineers to triage effectively.
Usecase 02: Asset list
50%
Reduction in response times
30%
Improvement in First-Time Fix Rate
Projected Outcomes
How might we transform complex IoT sensor data into an intuitive workflow that enables faster decision-making and proactive service operations?
My north star : Does the interface help users make better decisions faster?
This project reinforced my belief that a good UX design required domain understanding and context awareness.
Working in the agricultural technology space required me to think beyond traditional digital interfaces and consider the real-world constraints and pressures that technicians and engineers face daily.
The challenge of transforming complex IoT data streams into actionable insights taught me the importance of information architecture in data-heavy applications.
Learnings & Reflections
OVERVIEW
A Swedish farming machinery manufacturer, specializing in soil preparation and seeding equipment needed to digitize their FeedSeed machines by creating digital twin application and leveraging real-time data analytics to enhance operations across their global network.
As a part of this MVP project initiative, our team at Infosys wongdoody delivered a digital twin dashboard workflow that enables real-time global asset monitoring and prioritized error management.
My Contribution
As the UI/UX designer on this project, I collaborated with a team of domain experts (engineers, SMEs, developers) and a senior designer to establish the visual style guide and design the detailed high fidelity prototypes.